We put together an infographic summarizing 4 years of screening for cannabis use in schools, community settings, and hospitals. We are excited to share what we have learned from the 14,000 screens included in this summary.
Topics we describe include:
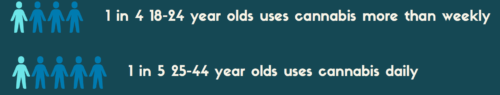
- Frequency of use by age
- Preferred method of use
- Reason(s) for use
- Impacts of use
- Association between frequency of use and risk of substance misuse disorder
- Association between frequency of use and depression, anxiety, or both